NFL Betting: Passing Yard Prop Bets, Game Totals and Point Spreads
October 9, 2020 – by Jason Lisk
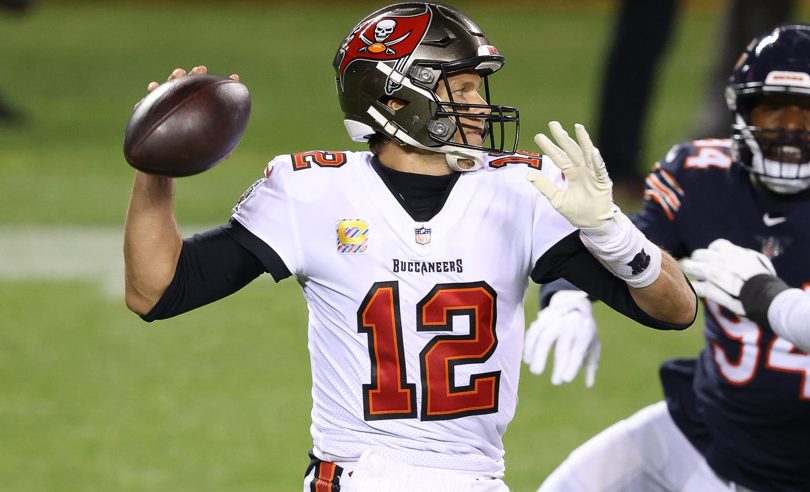
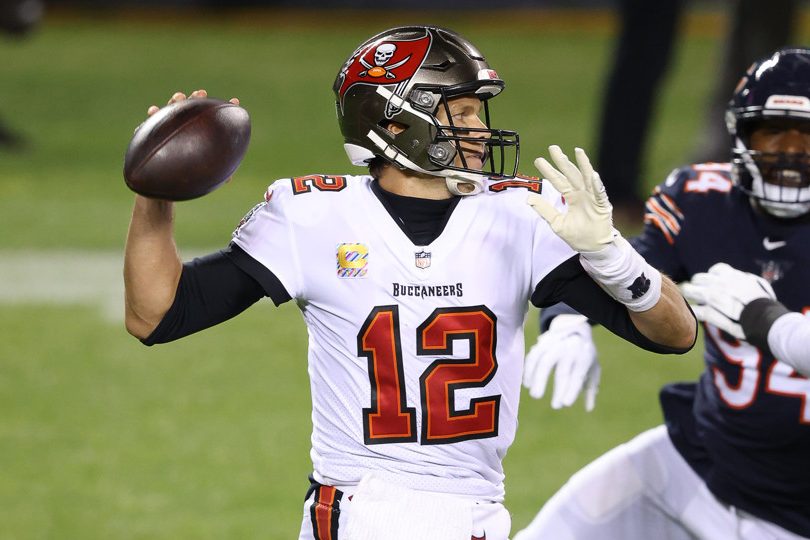
CHICAGO, IL – OCTOBER 08: Tampa Bay Buccaneers Quarterback Tom Brady (12) throws the football in game action during a NFL game between the Chicago Bears and the Tampa Bay Buccaneers on October 8th, 2020, at Soldier Field in Chicago, IL. (Photo by Robin Alam/Icon Sportswire)
Player props are becoming a bigger part of sports betting, with many books now offering a variety of wagers on individual performance numbers. Today, we are going to dive deep into passing yard totals, and how you might use team betting market numbers, such as the point spread and over/under totals, to inform your player prop wagers.
Our goal here is to educate you and provide some baseline expectations as you evaluate player passing props, as well as give you some information to consider on how to put the passing yard lines in context.

NFL Week 1 Picks
Betting – Survivor – Pick’em
Start Free TrialGet The Season
Passing Yards and the 2020 Scoring Explosion: Will Data from Other Seasons Still Be Useful for Player Prop Bets?
If we are going to use games from the recent past to inform the odds when it comes to player passing props, we first need to know if 2020 is different. And make no mistake, the scoring in 2020 so far is up. Passing yards are also up so far in 2020. Teams are averaging about 13 more passing yards per game in 2020 than they did for the 2015-2019 period.
But betting market point totals have also been higher so far this season. Once we account for the amount of higher point total games, the median passing yards are very similar to recent past seasons. This is a comparison of the first four weeks from 2015-2019, versus this season.
Median Passing Yards, 2020 versus Last 5 seasons, controlling for Over/Under totals
| Over/Under Total | 2020 Median Pass Yards | Last 5 Years Median Pass Yards |
|---|---|---|
| 38.5 to 42.0 | 215.5 | 229.5 |
| 42.5 to 46.0 | 254.0 | 250.5 |
| 46.5 to 50.0 | 262.5 | 261.5 |
| 50.5 to 54.0 | 269.5 | 285.5 |
| 54.5 to 58.0 | 315.0 | 306.5 |
So, for example, in games where the point total was between 38.5 and 42, the median result is 215.5 pass yards in 2020, versus 229.5 from 2015-2019.
Why would we want to use median here, by the way? Using a mean in this case could allow outlier events of extremely low or high passing yards to influence the data, particularly in cases where the sample size of relevant games isn’t large. If you went by the mean to determine average passing yards, for player prop purposes, you might tend to overestimate the likelihood of the “over” because of high passing yard games (which tend to be rare) that can dramatically pull the average up.
You can start to see from the above chart that passing yards tend to increase with point totals. That’s probably something that most people intuitively know, but they may not know the passing numbers you should expect at certain totals. So let’s dig further.
Passing Yards, Point Totals, and Point Spreads
This next chart groups all games since 2015 into different bins, based on both the point spread and the over/under point total. Any category that had fewer than 15 team-games is left blank. Again, the yards listed are the median passing yards for teams in that category.
Get access to all betting content, picks and models
Free subscription offers now available!
Subscribe now
Already a premium subscriber? Sign in for access
NFL Football Pool Picks NFL Survivor Pool Picks NCAA Bracket Picks College Bowl Pool Picks College Football Pool Picks NFL Picks NBA Picks MLB Picks College Football Picks College Basketball Picks NFL Predictions NBA Predictions MLB Predictions College Football Predictions College Basketball Predictions NFL Spread Picks NBA Spread Picks MLB Spread Picks College Football Spread Picks College Basketball Spread Picks NFL Rankings NBA Rankings MLB Rankings College Football Rankings College Basketball Rankings NFL Stats NBA Stats MLB Stats College Football Stats College Basketball Stats NFL Odds NBA Odds MLB Odds College Football Odds College Basketball Odds A product ofTeamRankings BlogAboutTeamJobsContact
© 2005-2024 Team Rankings, LLC. All Rights Reserved. Statistical data provided by Gracenote.
TeamRankings.com is not affiliated with the National Collegiate Athletic Association (NCAA®) or March Madness Athletic Association, neither of which has supplied, reviewed, approved or endorsed the material on this site. TeamRankings.com is solely responsible for this site but makes no guarantee about the accuracy or completeness of the information herein.
Terms of ServicePrivacy Policy